Chart
Renders a chart.
Node name : chart
Attributes
| Attribute | Type | Required | Default value | Description |
|---|---|---|---|---|
| type | string (bar, line, scatter, bubble, pie, doughnut, polarArea, radar) |
true |
Chart type. | |
| data | object |
true |
Chart data. The structure of the object depends of the type. |
|
| options | object |
false |
Chart options. The structure of the object depends of the type. |
Note
This component is powered by Chart.js.
The data and options objects must follow the format defined by Chart.js for each chart type.
You can pass these objects as anonymous types (as shown in the examples below) or define your own data objects that match the expected format.
For detailed structure and usage examples, refer to the official Chart.js documentation and samples.
Examples
Horizontal bar
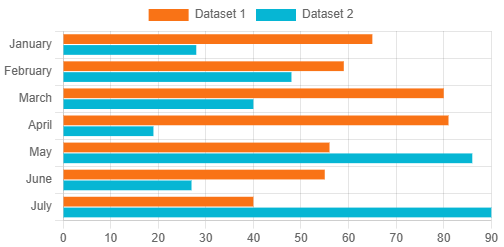
<chart type="bar" data="@Fields.HorizontalBarData" options="@Fields.HorizontalBarOptions" />
Fields.HorizontalBarData = new
{
    Labels = new[] { "January", "February", "March", "April", "May", "June", "July" },
    Datasets = new[]
    {
        new
        {
            Label = "Dataset 1",
            BackgroundColor = "rgb(249, 115, 22)",
            Data = new[] { 65, 59, 80, 81, 56, 55, 40 }
        },
        new
        {
            Label = "Dataset 2",
            BackgroundColor = "rgb(6, 182, 212)",
            Data = new[] { 28, 48, 40, 19, 86, 27, 90 }
        }
    }
};

Fields.HorizontalBarOptions = new
{
    IndexAxis = "y",
};
Mixed chart (Bar + Line)
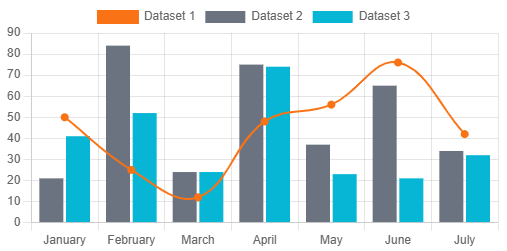
Fields.BarLineData = new
{
    Labels = new[] { "January", "February", "March", "April", "May", "June", "July" },
    Datasets = new[]
    {
        new
        {
            Type = "line",
            Label = "Dataset 1",
            Data = new[] { 50, 25, 12, 48, 56, 76, 42 },
            BackgroundColor = (string?)"rgb(249, 115, 22)",
            BorderColor = (string?)"rgb(249, 115, 22)",
            BorderWidth = 2,
            Fill = (bool?)false,
            Tension = (decimal?)0.4,
        },
        new
        {
            Type = "bar",
            Label = "Dataset 2",
            Data = new[] { 21, 84, 24, 75, 37, 65, 34 },
            BackgroundColor = (string?)"rgb(107, 114, 128)",
            BorderColor = (string?)null,
            BorderWidth = 0,
            Fill = (bool?)null,
            Tension = (decimal?)null,
        },
        new
        {
            Type = "bar",
            Label = "Dataset 3",
            Data = new[] { 41, 52, 24, 74, 23, 21, 32 },
            BackgroundColor = (string?)"rgb(6, 182, 212)",
            BorderColor = (string?)null,
            BorderWidth = 0,
            Fill = (bool?)null,
            Tension = (decimal?)null,
        }
    }
};